LoadView
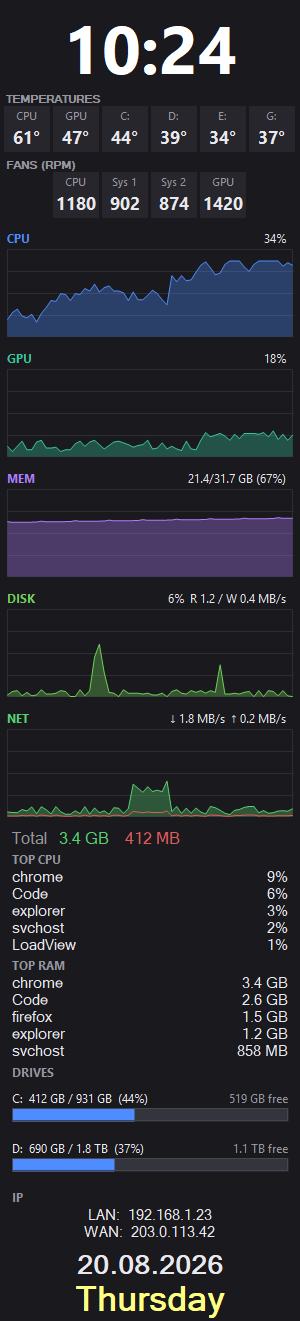
Task Manager's performance graphs, pinned to the corner of your screen.
A lightweight, always-on-top Windows overlay showing live CPU, GPU, RAM, disk and
network graphs — plus temperatures, per-drive usage, top processes, a clock and
your IP — as a single portable .exe. No install, no dependencies.
Windows 10 / 11
Free & open-source (MIT)
No install
Works with Memory Integrity
- Everything at a glance — live CPU / GPU / RAM / disk / network graphs, plus session data-transfer totals (downloaded / uploaded), top-5 CPU & RAM processes, and a clock, date & weekday.
- Temperature tiles — CPU, GPU and every disk that reports one, as labelled squares. Disk temperatures need no driver and no administrator (SATA drives included, read from SMART), and each kind of component has its own “too hot” threshold — 70 °C is an ordinary CPU and a worrying disk.
- Fan speeds (RPM) — their own section on boards that expose them, next to a chipset temperature.
- Accurate CPU temperature (optional) — one administrator prompt once, then silent on every launch, working with Memory Integrity on and even when your account is not an administrator.
- Drives & IP — per-drive usage bars with free space, including mapped network drives, plus your LAN and public (WAN) IP with an optional country and flag.
- Dark, light or follow-system theme; vendor-neutral and DPI-agnostic — the same counters Task Manager uses, crisp at any scaling, and it remembers its position per screen resolution.
- Fully configurable — resize, reorder or hide any section; per-graph colours, max & red alerts; MB/s or Mbps; °C/°F; opacity; always-on-top or coverable; lock.
- Single portable exe — one
LoadView.exe, no install; runs on any Windows 10/11 PC.